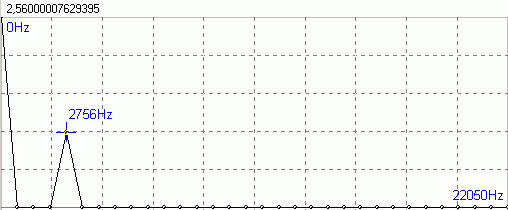
So, the resolution does not depend on signal values - it depends on sampling frequency and number of samples. Assume the former is 44100, the latter is 1024. Then the frequency step is 44100/1024 = 43.066Hz

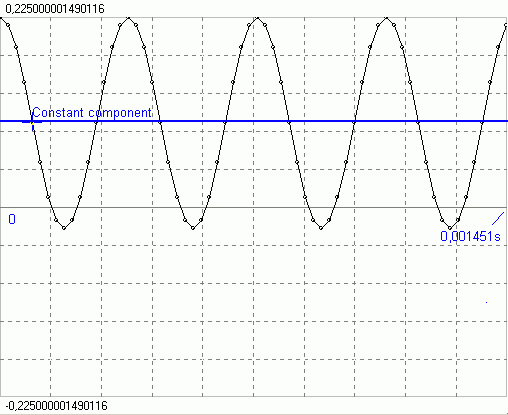
There are 64 values in the sampled time signal.
Assume the sampling frequency is 44100.
Then the signal duration is 64 / 44100 = 0,00141 sec.
It would be exactly 1 sec if we had 44100 samples - but we only have 64.
The signal consists of constant component and a sine wave. It
is also important to note that exactly 4 periods of sine wave fit in the
time signal being analysed.
